This part of the course will focus on Topographic map reading and attempt to empower the user with a better understanding of the legend, map color conventions, contour lines, terrain features, grid systems, grid lines, declination and map scale. With a better comprehension of these map conventions, the use of topographic maps in Land Navigation will provide greater accuracy in plotting courses, identifying terrain features,
Part 2, Topographic Maps
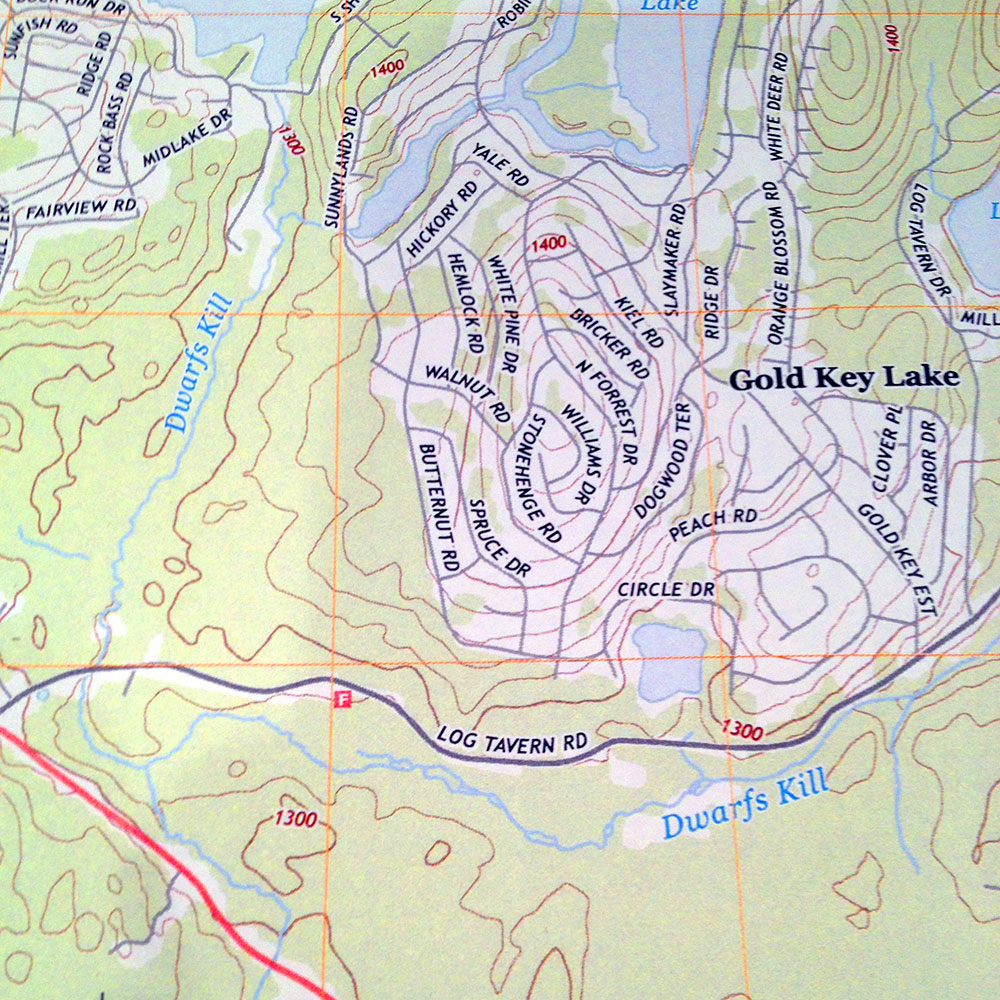
Colors on a map.
 By about the fifteenth century, most European maps were carefully colored. Profile drawings of mountains and hills were shown in brown, rivers and lakes in blue, vegetation in green, roads in yellow, and special information in red (“X marks the spot”.) A look at the legend of a modern map confirms that the use of colors has not changed much over the past several hundred years. To facilitate the identification of features on a map, the topographical and cultural information is usually printed in different colors. These colors vary from map to map.
Most standard large-scale topographic maps will use the colors to represent features as shown here:
- Black. indicates cultural (man made) features such as buildings and roads, surveyed spot elevations, and all labels.
- Blue. Identifies hydrography or water features such as lakes, swamps, rivers, and drainage.
- Green. Identifies vegetation such as woods, orchards, vineyards, etc.
- Brown. Identifies all relief features and elevation, contour lines, non-surveyed spot elevations.
- Red. Classifies cultural features, such as populated areas, main roads, and boundaries.
- White. Non vegetated or sparsely vegetated areas.
Grid systems.
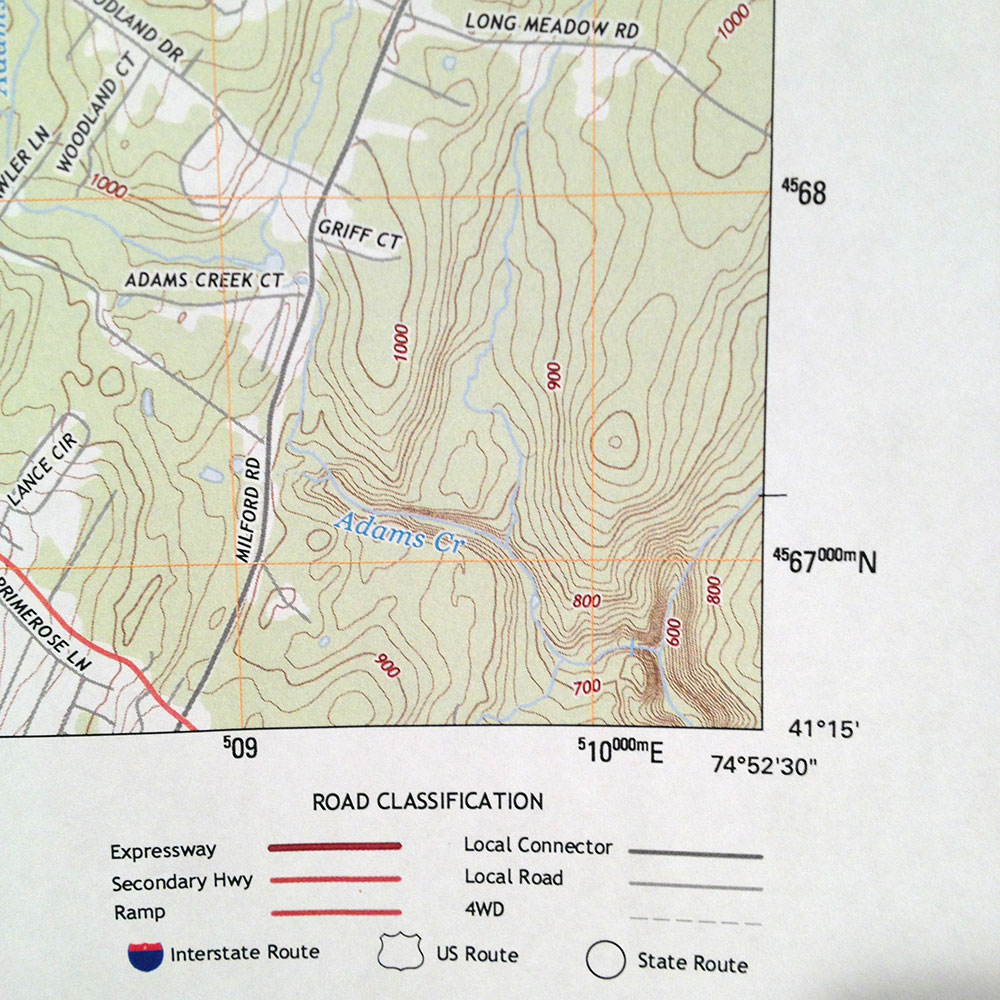 Around the perimeter of any map quad are strings of Numbers running all the way around the grid. These numbers represent the two types of Grid systems represented on the map. The exact Latitude and Longitude is represented at the four corners of the map, and then are graduated at equal intervals along the edge. The second set of numbers, usually represented in Bold, and a smaller type, is the Universal Transverse Mercator (UTM) grid coordinate system.
Latitude and Longitude.
Latitude is the angular distance measured north or south of the Equator, which is 0 degrees. Proceeding north of the Equator, Latitude increases up to 90 degrees at the North pole. Proceeding South of the Equator, Latitude increases up to 90 degrees at the South pole. Coordinates north of the equator are called out as “degrees North”, and coordinates south of the equator are called out as “degrees South”.
Similarly, Longitude is measured in degrees east and west from the Prime Meridian, with the Prime Meridian at 0 degrees. Heading East from the Prime Meridian the Longitude increases 180 degrees until the International Date Line, on the other side of the globe. Heading west from the prime meridian, the Latitude increases 180 degrees toward the International Date Line. The Eastern Hemisphere is expressed in degrees East, and the western hemisphere is expressed in Degrees West.
At the equator, one degree of Latitude is equal to approximately 7o miles. The further away from the Equator you are, the distance represented by one degree of Latitude decreases. Degrees of Longitude remain the same as you travel west or east. This is because Latitude lines get closer together near the poles.
One degree of Longitude and Latitude covers a maximum of about 4900 square miles on the ground. So to further define locations, a degree is divided into 60 Minutes. One minute of one degree Longitude is approximately 1.2 miles on the ground. A minute can further be divided into 60 seconds, with an accuracy of approximately .02 miles on the ground.
Universal Transverse Mercator (UTM), Universal Polar Stereographic (UPS), and the Military Grid Reference System (MGRS).
The MGRS grid system is the standard we use in the Irminfyrd. It is the standard favored by NATO, Scientists, Surveyors, Researchers, and Emergency services which uses Meters and Kilometers rather than degrees and Miles. The MGRS is derived from the Universal Transverse Mercator (UTM) grid system and the universal polar stereographic (UPS) grid system, but uses a slightly different labeling convention. The MGRS is used for the entire earth.
A complete example of an MGRS Coordinate would be 18TVM96710749 (the precise location of the Irminfolk’s Sumbel Pavilion often used during this part of this courses’ instruction.) It consists of three parts. They are shaded in different colors here only to help with the courses’ instruction.
18T VM 9671 0749
18T is the Grid Zone Designator, VM is the 100,000 square meter identifier and 96710749 is the numerical location expressed in Eastings 9671, and Northings 0749, in this case specifying a location within 10 meters of resolution.
- 18T … GZD only, Precision level 6° × 8° (in most cases)
- 18TVM … GZD and 100 square kilometer square ID, Precision level 100 kilometers.
- 18TVM90 … Precision level 10 Kilometers
- 18TVM9607 … Precision level 1 Kilometer (This is a “four digit grid”)
- 18TVT967074 … Precision Level 100 Meters (“Six digit grid”)
- 18TVT96710749 … Precision level 10 meters. (“Eight Digit Grid”)
- 18TVT9671307499 … Precision Level 1 meter (“Ten Digit grid”)
Grid Zone Designator
The Grid Zone Designator (GZD) is a 6° wide UTM zone numbered 1-60 which is intersected by latitude bands usually 8° high lettered C-X (omitting the I and the O).
The 100,000 meter Square Identification.
The second part of an MGRS coordinate is the 100,000-meter square identification. Each UTM zone is divided into 100,000 meter squares, so that their corners have UTM-coordinates that are multiples of 100,000 meters. The identification consists of a column letter (A–Z, omitting I and O) followed by a row letter (A–V, omitting I and O).
Numerical Location.
The third part of an MGRS coordinate is the numerical location within a 100,000 meter square. If a coordinate representing a 10 meter square is measured, such as the example given 96710749, a four digit + four digit number is used. This resolution is sufficient for most tasks and is standard for NATO coordinate specification. The first 4 digits give the easting in meters, measured from the left edge of the square, and the last 4 digits give the northing in meters, measured from the bottom edge of the square. If 1 meter of precision is needed, then a coordinate consisting of a 5 digit easting + a 5 digit northing is used (9671307499).
Always remember, when reading coordinates, the first half of the coordinate string is the Eastings, read from left to right, and the second half of the string is the Northings, read from bottom to top. Thin “down the hall and up the Stairs” or “in and up” when trying to remember the order.
When converting UTM coordinates to an MGRS grid reference, or when abbreviating an MGRS grid reference to lower precision, one should truncate the coordinates, not round.
Declination: North, North and North are not the same.
 There are three different points called “north”. True North is the point of the Earths Axial rotation on the Northern Hemosphere. Magnetic North is the point of the Earths’ Magnetic North pole. And grid North is the point where all of the Lolgitudinal Lines on a map converge.
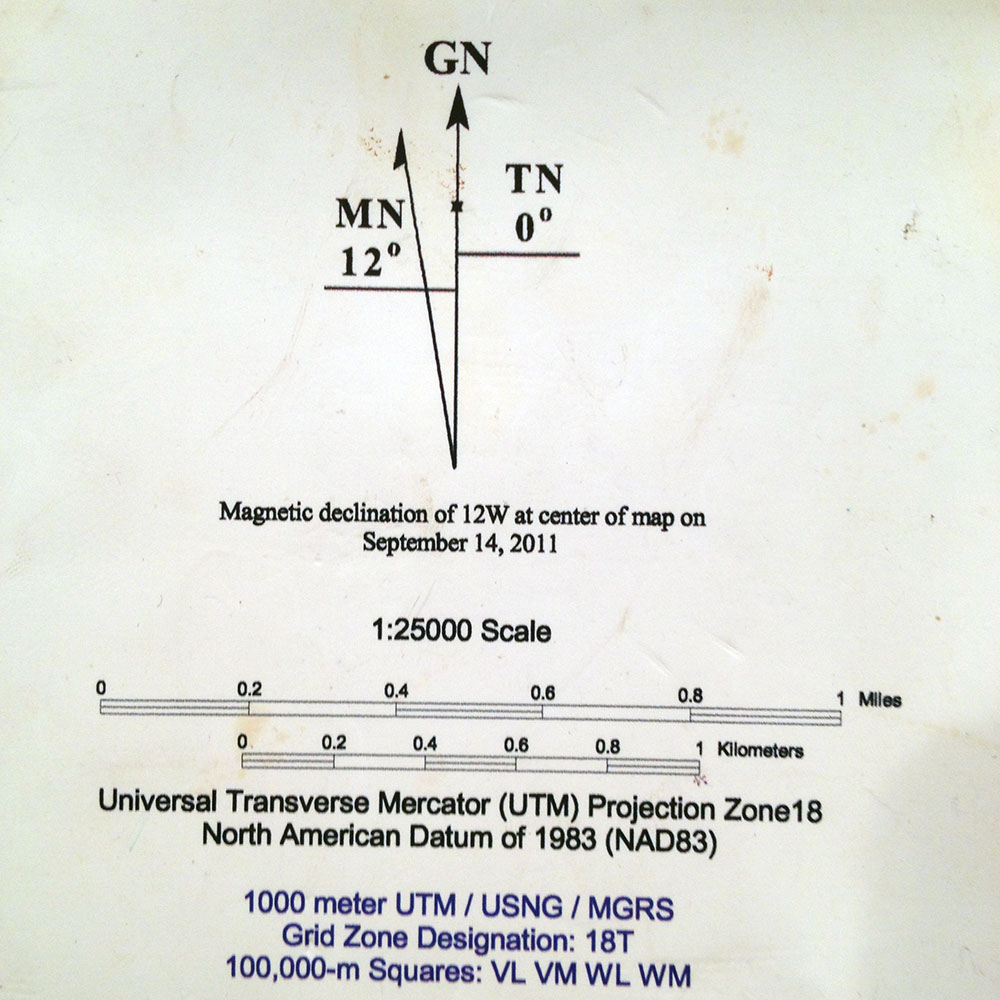
Declination is the difference, expressed in degrees, between two Norths. When using a map and a magnetic compass for Navigation the declination that is of most importance is that between the Magnetic North, and the Grid North. That is, the North that the compass’ dial is pointing to, compared to the vertical lines drawn on the map.
There is usually an angular difference between Grid north and Magnetic north. since the location of the Magnetic North Pole does not correspond exactly with the Grid north lines on maps, a conversion from magnetic to grid or vice versa is needed.
The declination for every map is shown on the bottom of the mapsheet.
For example, if you aim your compass at a distant point, and the compass reading you get is 190 degrees (the Magnetic Azmuth), and the declination diagram on your map tells you that the Grid/Magnetic angle is -12° (westerly), then you would subtract the declination from the Magnetic reading. 190 – 12 = 178. Your Grid Azmuth is 178°.
If your map specifies that the declination is Easterly (eg. plus 12°), then add this number to the Magnetic Azmuth to get your Grid Azmuth.
Contour Lines.
Contour lines are used to show relief and elevation on a Topographic map. Contour lines are usually brown or red-brown in color. A contour like represents an imaginary line on the ground indicating the vertical distance above or below sea level. All points along a contour line are at the same elevation. There are three types of contour lines used on standard topographic maps.
- Index Contour line. Starting at Zero elevation or mean sea level, every fifth contour line is heavier. These are known as Index contour lines. Normally each index contour line is numbered at some point indicating its elevation.
- Intermediate Contour lines. The contour lines falling between the Index contour lines are called intermediate contour lines. These lines are finer and do not have their elevations given. There are normally four intermediate contour lines between Index contour lines.
- Supplementary Contour lines. These contour lines resemble dashes. They show changes in elevation of at least one-half the contour interval. These lines normally are found where there is very little change in elevation, such as on fairly level terrain.
Terrain features on a topographic map.
Hill. A hill is an area of high ground. From a hilltop, the ground slopes down in all directions. A hill is shown on a map by contour lines forming concentric circles. The inside closed circle is the hilltop.
Saddle. A saddle is a dip or low point between two areas of higher ground. A saddle is not necessarily the lower ground between two hilltops; it may be simply a dip or break along a level ridge crest. If you are in a saddle, there is high ground in two opposite directions and lower ground in the other two directions. A saddle is normally represented as an hourglass.
Valley. A valley is a stretched-out groove in the land, usually formed by streams or rivers. A valley begins with high ground on three sides, and usually has a course of running water through it. If standing in a valley, three directions offer high ground, while the fourth direction offers low ground. Depending on its size and where a person is standing, it may not be obvious that there is high ground in the third direction, but water flows from higher to lower ground. Contour lines forming a valley are either U-shaped or V-shaped. To determine the direction water is flowing, look at the contour lines. The closed end of the contour line (U or V) always points upstream or toward high ground.
Ridge. A ridge is a sloping line of high ground. If you are standing on the centerline of a ridge, you will normally have low ground in three directions and high ground in one direction with varying degrees of slope. If you cross a ridge at right angles, you will climb steeply to the crest and then descend steeply to the base. When you move along the path of the ridge, depending on the geographic location, there may be either an almost unnoticeable slope or a very obvious incline. Contour lines forming a ridge tend to be U-shaped or V-shaped. The closed end of the contour line points away from high ground.
Depression. A depression is a low point in the ground or a sinkhole. It could be described as an area of low ground surrounded by higher ground in all directions, or simply a hole in the ground. Usually only depressions that are equal to or greater than the contour interval will be shown. On maps, depressions are represented by closed contour lines that have tick marks pointing toward low ground.
Cliff. A cliff is a vertical or near vertical feature; it is an abrupt change of the land. When a slope is so steep that the contour lines converge into one “carrying” contour of contours, this last contour line has tick marks pointing toward low ground. Cliffs are also shown by contour lines very close together and, in some instances, touching each other.